JonnyTheWomble
New Member
Hi all, I'm not sure if someone else wanted to do this or not, if so then you're welcome to take over. For now I'm happy to do it, and can do for the rest of the season with weekly updates if people want me to.
But even so... the time is coming, and most clubs have reached the last 10 games of the season mark. Here's the real league one table for the 2016/17 season!
Guaranteed positions are worked out by the maximum number of points that clubs can collect. So, because Oldham have the 4th lowest maximum points (69) the guaranteed safety line is 70. (69+1)
Arguably this could be 69 as you can stay up on goal difference, but hey, I'm sure you can -1
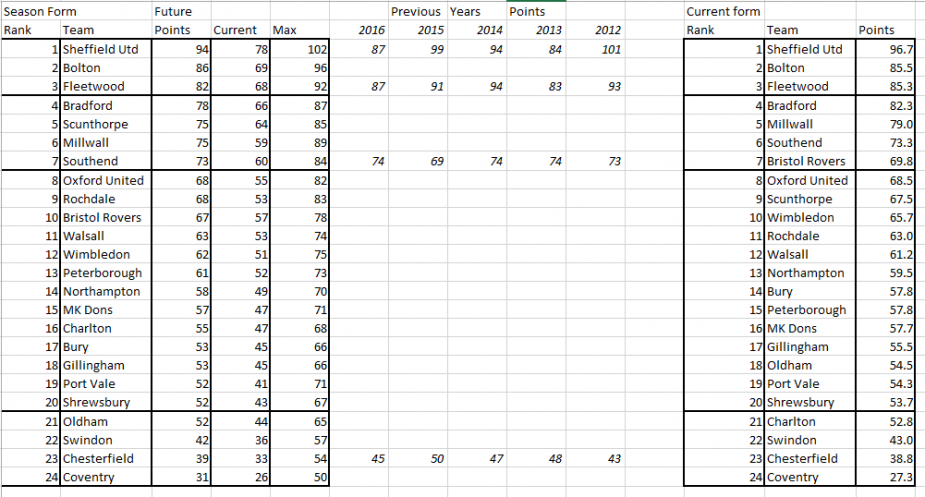
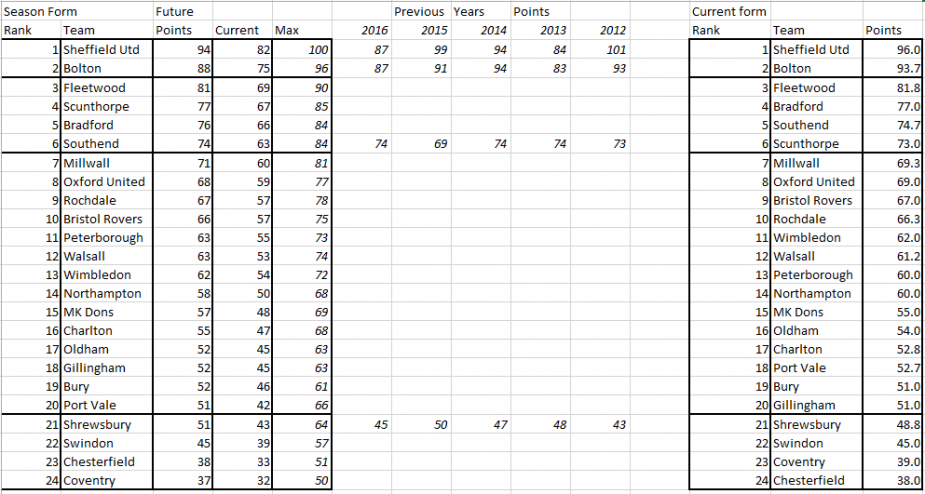
I've added two predicted positions, one using the season long points per game (points divided by games played) and the other using current form, which uses the same calculation except the games played only include the last 6.
Each club is positioned next to their current amount of points, and their maximum amount has been added next to their name in brackets.
103 (Champions 2014)
102
101 - (Champions 2012)
100
99 - (Champions 2015)
98 - (Guaranteed champions 2017)
97 - (Guaranteed promotion 2017)
96
95
94 - (Promotion 2014)
93 - (Promotion 2012)
92
91 - (Promotion 2015. Predicted champions on both season and current form 2017)
90 – (Predicted promotion on current form 2017. Guaranteed playoffs 2017)
89
88
87 - (Champions 2016)
86
85 - (Promotion 2016)
84 - (Champions 2013. Predicted promotion on season form 2017)
83 - (Promotion 2013)
82
81
80
79
78
77
76
75 - (Predicted playoffs on season form 2017)
74 - (Playoffs 2016, 2014, 2013. Predicted playoffs on current form 2017)
73 – (Playoffs 2012)
72
71
70 - (Guaranteed safety 2017)
69 – Sheffield united 102 (Playoffs 2015)
68
67
66
65
64 – Fleetwood 97
63
62
61 – Scunthorpe 94
60 – Bolton 96
59 – Bradford 89
58 – Millwall 91
57
56
55
54 – Southend 87
53
52
51 – Bristol Rovers 81 (Safety 2015)
50 – Peterborough 89 (Predicted safety on season form 2017)
49 – Walsall 82, Rochdale 88, Oxford 88 (Safety 2013)
48 - (Safety 2014)
47 – Wimbledon 80
46 - (Safety 2016)
45 – (Predicted safety on current form 2017)
44 – (Safety 2012)
43 – Northampton 73, Milton Keynes 73
42 – Shrewsbury 72, Gillingham 72, Charlton 75
41
40 – Bury 70
39 – Oldham 69
38
37
36 – Swindon 66
35 – Port Vale 74
34
33
32
31 – Chesterfield 64
30
29
27
26 – Coventry 59
PS I used to be called JonnyWomble :O but due to a mix up with my emails, I've had to make a new account. If you see any mistakes be sure to mention them.
But even so... the time is coming, and most clubs have reached the last 10 games of the season mark. Here's the real league one table for the 2016/17 season!

Guaranteed positions are worked out by the maximum number of points that clubs can collect. So, because Oldham have the 4th lowest maximum points (69) the guaranteed safety line is 70. (69+1)
Arguably this could be 69 as you can stay up on goal difference, but hey, I'm sure you can -1
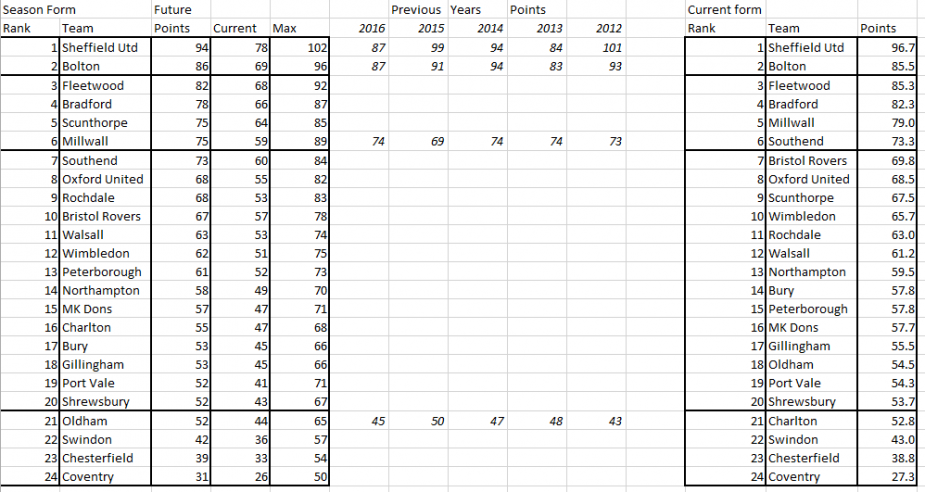
I've added two predicted positions, one using the season long points per game (points divided by games played) and the other using current form, which uses the same calculation except the games played only include the last 6.
Each club is positioned next to their current amount of points, and their maximum amount has been added next to their name in brackets.
103 (Champions 2014)
102
101 - (Champions 2012)
100
99 - (Champions 2015)
98 - (Guaranteed champions 2017)
97 - (Guaranteed promotion 2017)
96
95
94 - (Promotion 2014)
93 - (Promotion 2012)
92
91 - (Promotion 2015. Predicted champions on both season and current form 2017)
90 – (Predicted promotion on current form 2017. Guaranteed playoffs 2017)
89
88
87 - (Champions 2016)
86
85 - (Promotion 2016)
84 - (Champions 2013. Predicted promotion on season form 2017)
83 - (Promotion 2013)
82
81
80
79
78
77
76
75 - (Predicted playoffs on season form 2017)
74 - (Playoffs 2016, 2014, 2013. Predicted playoffs on current form 2017)
73 – (Playoffs 2012)
72
71
70 - (Guaranteed safety 2017)
69 – Sheffield united 102 (Playoffs 2015)
68
67
66
65
64 – Fleetwood 97
63
62
61 – Scunthorpe 94
60 – Bolton 96
59 – Bradford 89
58 – Millwall 91
57
56
55
54 – Southend 87
53
52
51 – Bristol Rovers 81 (Safety 2015)
50 – Peterborough 89 (Predicted safety on season form 2017)
49 – Walsall 82, Rochdale 88, Oxford 88 (Safety 2013)
48 - (Safety 2014)
47 – Wimbledon 80
46 - (Safety 2016)
45 – (Predicted safety on current form 2017)
44 – (Safety 2012)
43 – Northampton 73, Milton Keynes 73
42 – Shrewsbury 72, Gillingham 72, Charlton 75
41
40 – Bury 70
39 – Oldham 69
38
37
36 – Swindon 66
35 – Port Vale 74
34
33
32
31 – Chesterfield 64
30
29
27
26 – Coventry 59
PS I used to be called JonnyWomble :O but due to a mix up with my emails, I've had to make a new account. If you see any mistakes be sure to mention them.
Last edited:

 at the moment.


